
San Juan County real estate market summary | Paid content
Published 1:30 am Thursday, July 13, 2023

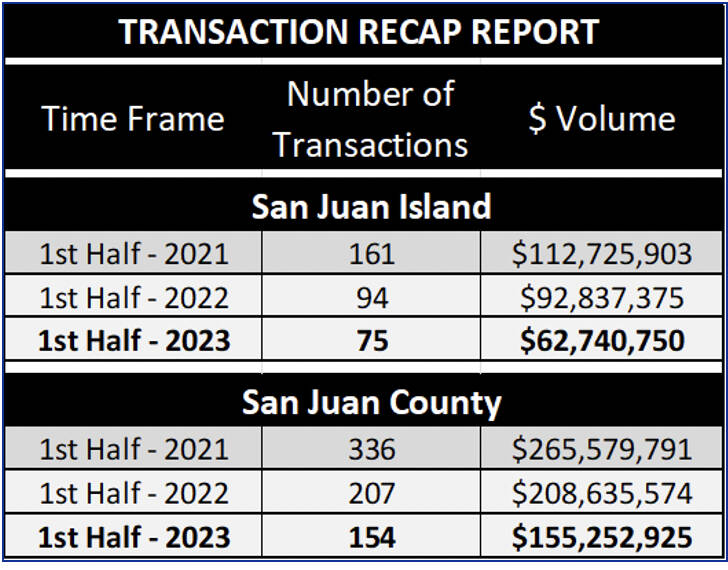


The second quarter results, which completed the first half of the year, in San Juan County and on San Juan Island reflected the market change. Per the NWMLS, the dollar volume for the first half of the year in San Juan County was $155,252,925 with a total of 154 transactions. The numbers reflect a 26% decrease in both the dollar volume and in the number of transactions as compared to the same 6-month period in 2022.
For San Juan Island, the transaction volume was $62,740,750 with a total of 75 transactions. This was a 32% decrease in dollar volume and a 20% decrease in number of transactions.
Based on my 28 years of analysis of our local market, I believe that this is a very unusual market. The buyer pool is smaller than standard for this time of year. The inventory is increasing, and some nice properties are being listed. The high interest rates are having an impact on the sales under $1M which is the price range where institutional financing is most typical.
Some new listings are getting a lot of attention and selling in a timely manner, so we have some able, willing, and active buyers in the marketplace, but it is all about the pricing.
Our sellers need to price in this market, not in the market that was present the first half of 2022.
Some buyers are being told by their financial planners to wait until fall as the market may further correct and favor them at a higher level. Perhaps the financial planners do have a crystal ball, I sure wish I did. Or just maybe, the financial planners are predicting the reoccurring slow down at the end of summer that typically changes the seller’s motivation levels.
At the same time, a few of the listings are experiencing multiple offers with escalating prices or at least full price offers. This circles back around to having the property priced properly in the beginning.
The Zillow Buyer leads and “hits” on our listings are also down in their numbers, fewer active buyers.
Again, a very unusual market.
The pending transaction number as of June 30, 2023, for the County was 39 which is down as compared to June 2022. The June 2022 to June 2023 range for the number of pending transactions was a high of 49 in the end of August 2022 and down to a low of 24 in January of 2023. Now back up to the current number of 39.
The June 30, 2023, pending transaction number for San Juan Island was 26 which is slightly up as compared to June 2022. The June-to-June range was a high of 38 at the end of August 2022 to a low of 9 at the end of March 2023.
The total number of listings is 273 for the County and 116 for San Juan Island. These totals include ACTIVE and PENDING properties. The last time we had these levels was in August of 2021. However, back then our number of pending transactions was much higher; with 96 and 45 for the County and San Juan Island, respectively. A quite different market due to COVID, lower interest rates and a strong buyer relocation desire.
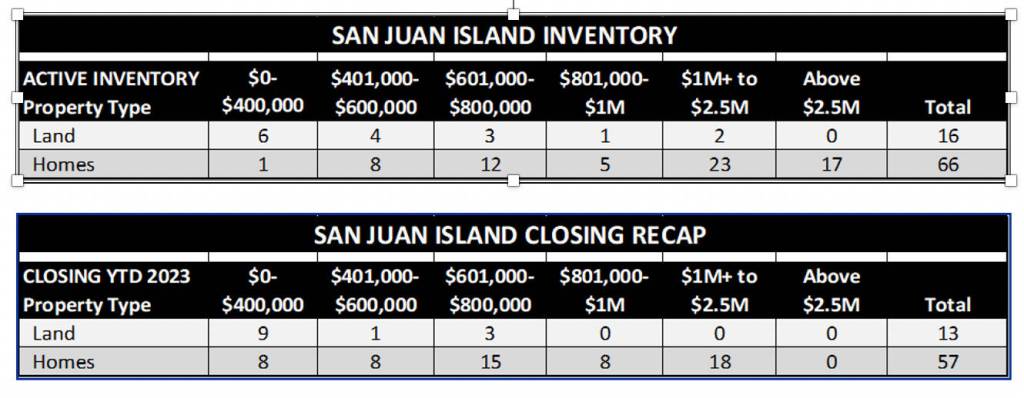
Note the inventory chart below does not include the 10 commercial, business or multi-family listings nor does the Closing Recap chart include the 5 commercial, business or multi-family closings.
The land sales have decreased due to the cost of financing and the cost of new construction. It is still more cost effective to buy existing and remodel than it is to build new custom construction. The most active segment for land sales has been the lower-end priced parcels, which are those under $400,000. Some of these parcels offer acreage and/or small water views.
Year to date, the most active segment of our market are those homes that sold under $1M each, these represented 70% of the 57 total sales. Although having 18 closed home sales over $1M is a strong showing as well. At this time, the homes listed over $1M category has more inventory and selection for buyers.
An unusual market equates to the inability to predict how the year will end up. Typically, by the end June, the pattern is formed, and I can express an opinion, not this year.